
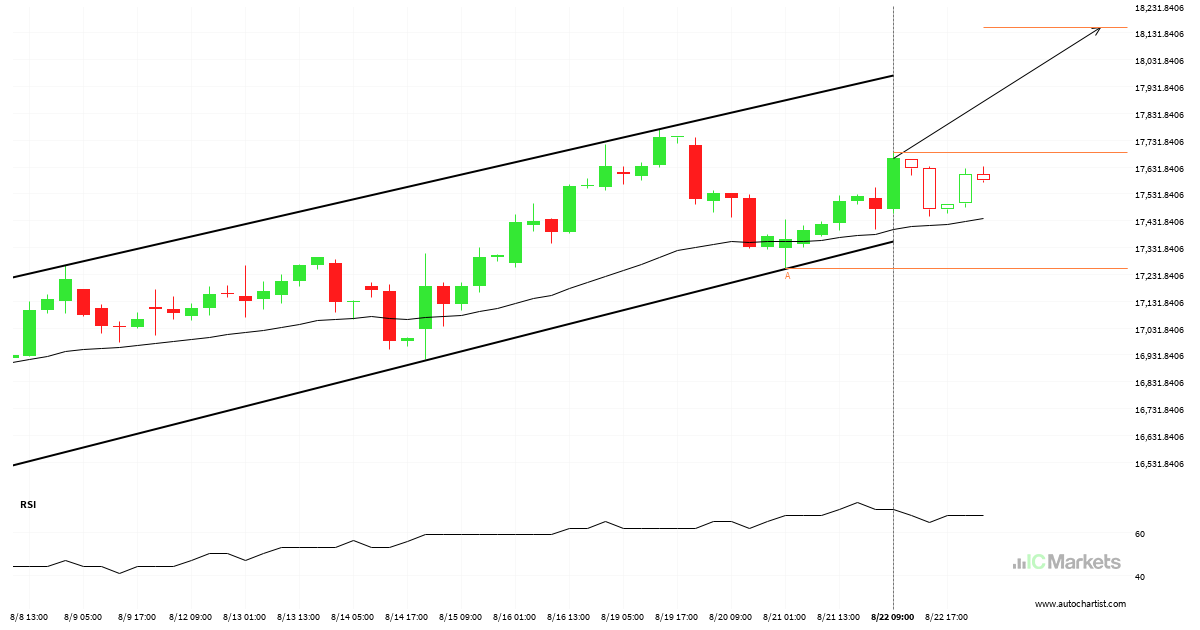
Breach of important price line imminent by Hong Kong 50 Index
The price of Hong Kong 50 Index in heading back to the resistance area. It is possible that it will struggle to break through it and move back in the other direction. The price may eventually break through, but typically the price retreats from the level a number of times before doing so.
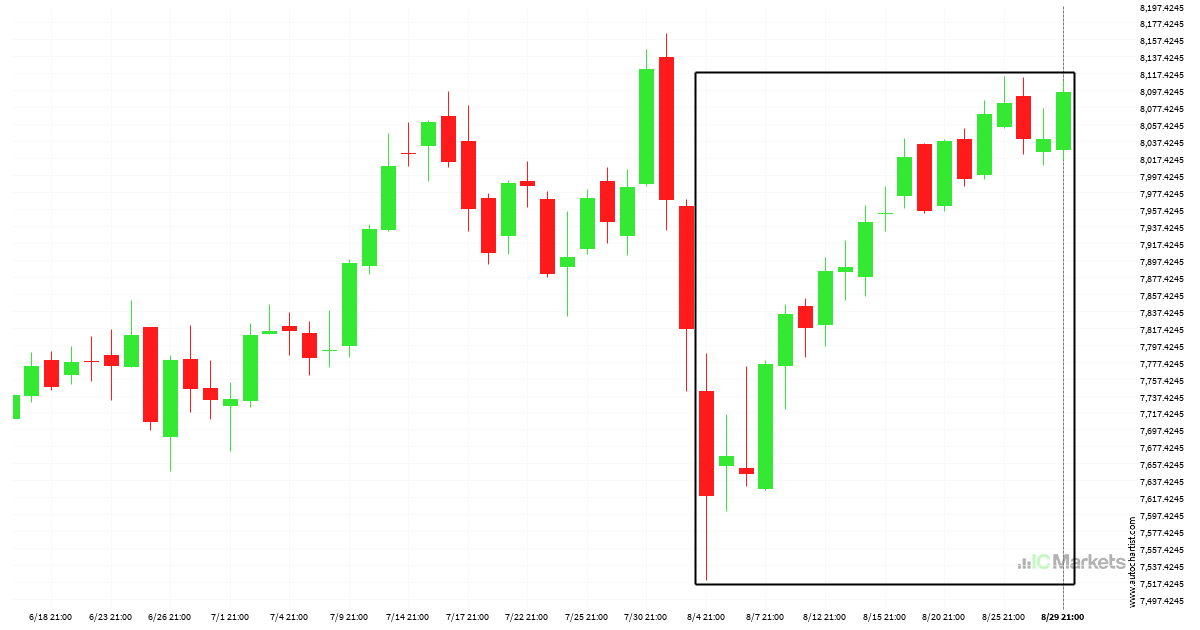
Australia 200 Index is on its way up
Australia 200 Index has experienced an exceptionally large movement higher by 6.23% from 7618.66 to 8093.68 in the last 26 days.
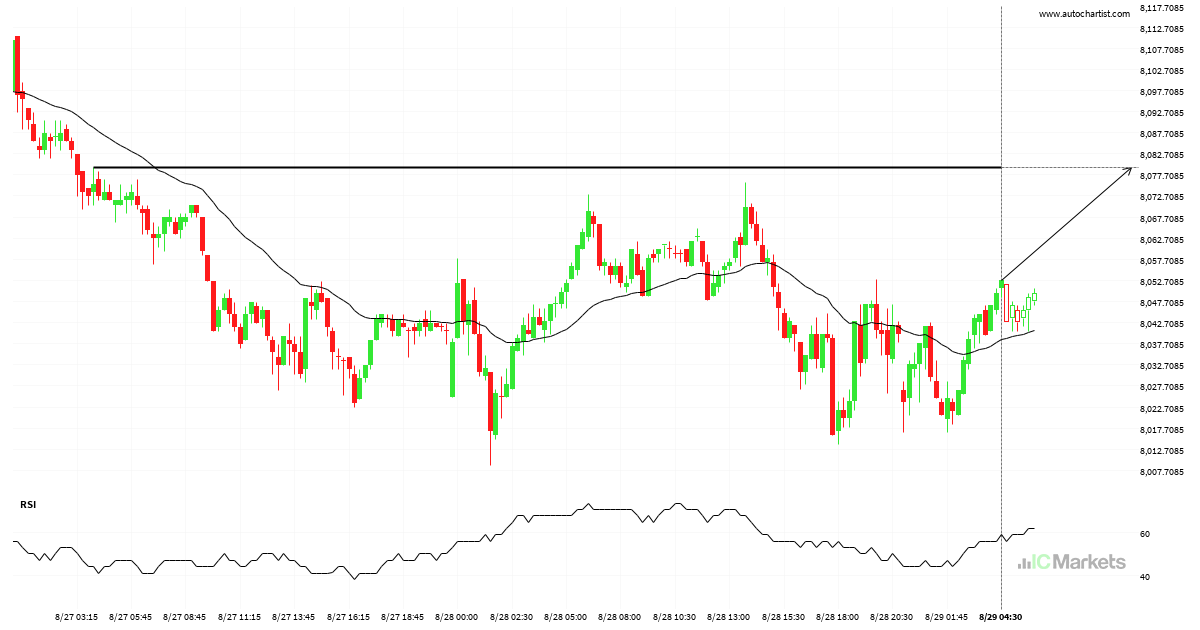
A potential bullish movement on Australia 200 Index
Australia 200 Index is moving towards a line of 8079.5298 which it has tested numerous times in the past. We have seen it retrace from this position in the past, so at this stage it isn’t clear whether it will breach this price or rebound as it did before. If Australia 200 Index continues in […]
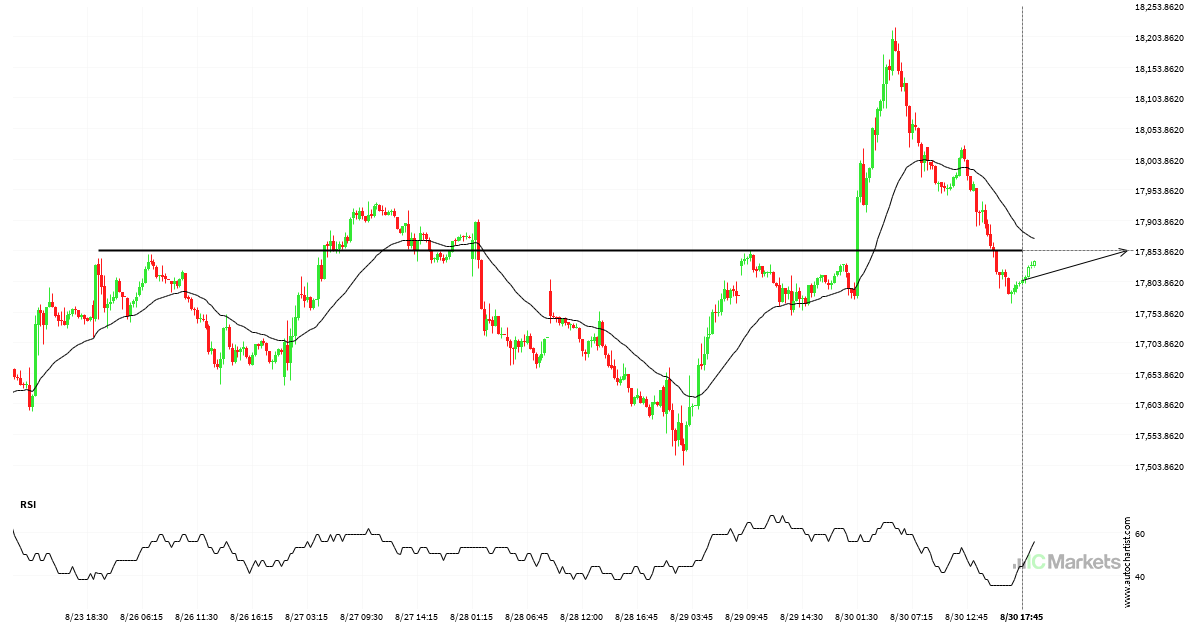
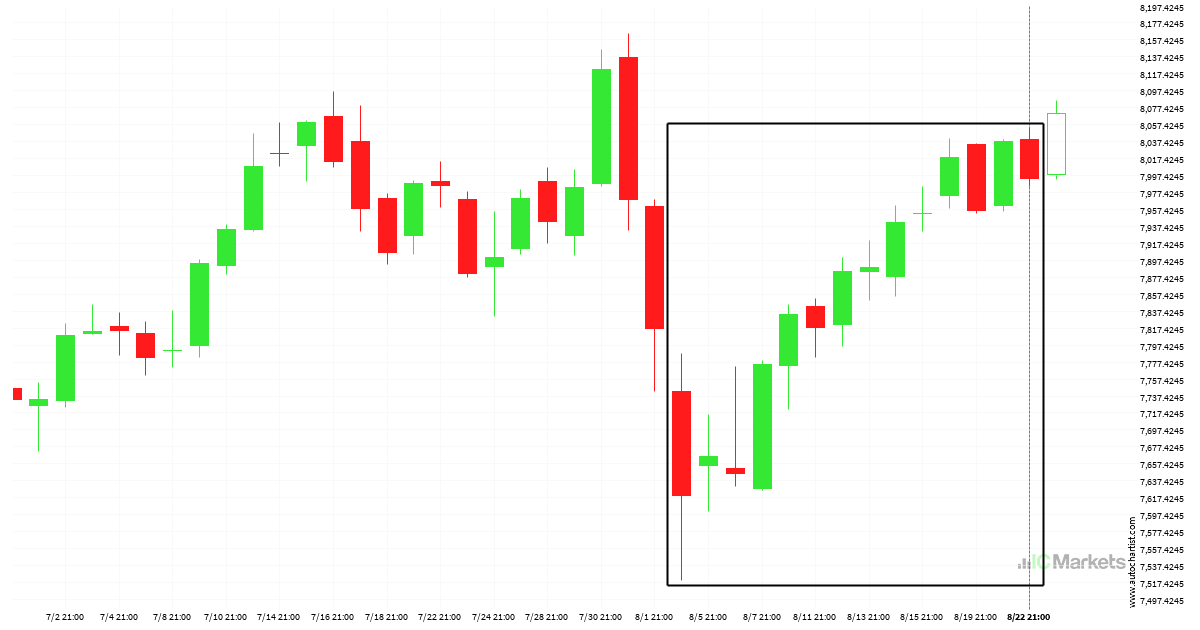
Support line breached by Hong Kong 50 Index
This trade setup on Hong Kong 50 Index is formed by a period of consolidation; a period in which the price primarily moves sideways before choosing a new direction for the longer term. Because of the bearish breakout through support, it seems to suggest that we could see the next price move to 17432.1576.
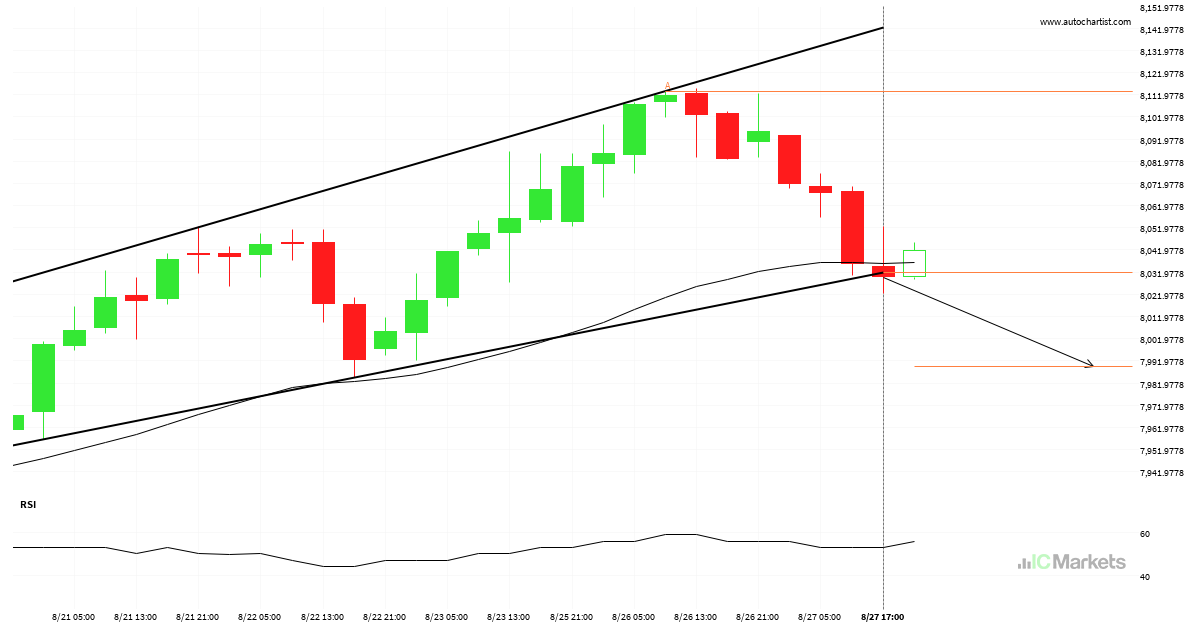
Australia 200 Index trade outlook at 2024-08-27T15:00:00.000Z until 2024-08-27T15:00:00.000Z
Flag pattern identified on Australia 200 Index has broken through a support level with the price momentum continuing to move in an downward direction. A solid trading opportunity continues with the price expected to reach 7989.3152 in the next 2.
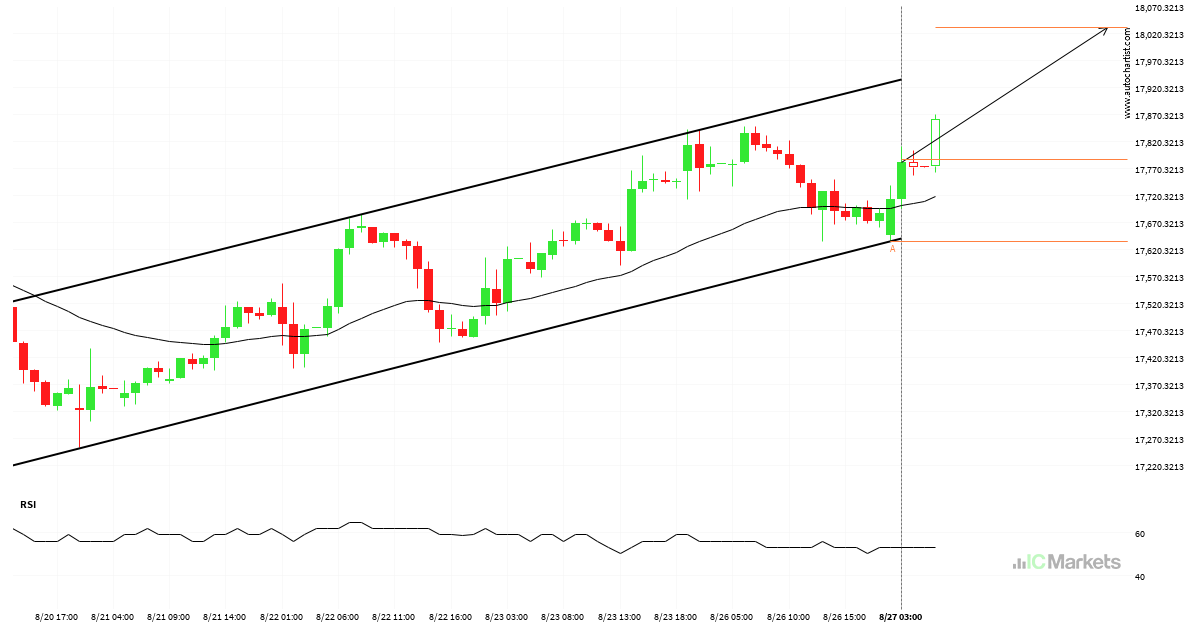
Possible breach of resistance level by Hong Kong 50 Index
Emerging Channel Up pattern in its final wave was identified on the Hong Kong 50 Index 1 hour chart. After a strong bullish run, we find Hong Kong 50 Index heading towards the upper triangle line with a possible resistance at 18029.9175. If the resistance shows to hold, the Channel Up pattern suggests a rebound […]

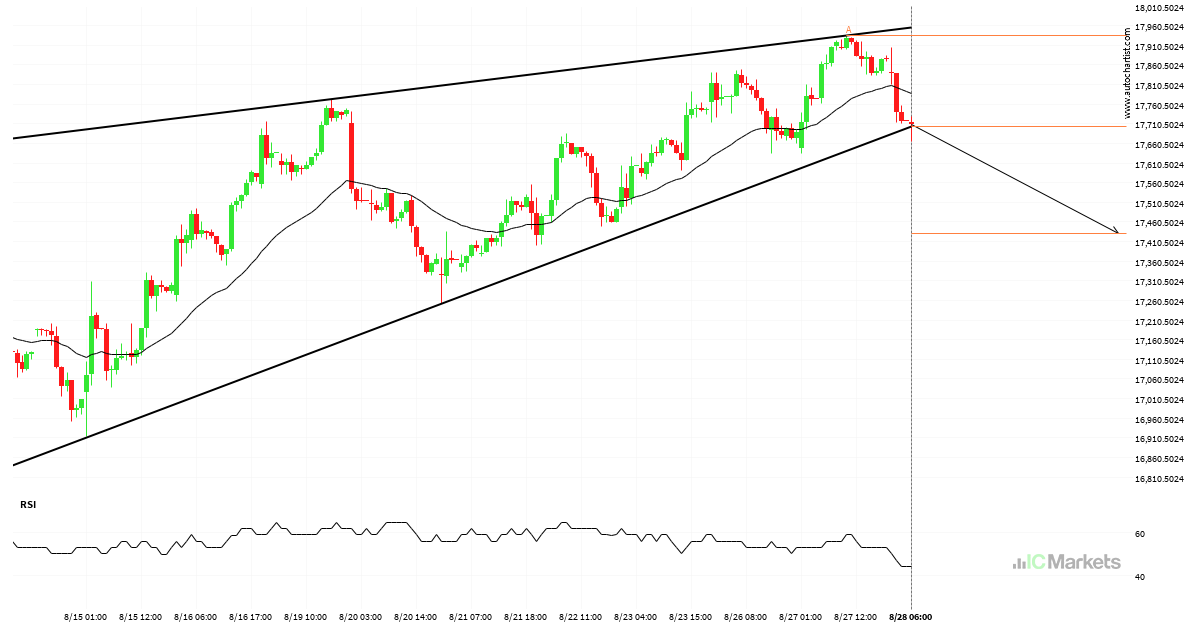
Will Australia 200 Index have enough momentum to break support?
Australia 200 Index is heading towards the support line of a Channel Up. If this movement continues, the price of Australia 200 Index could test 8038.0775 within the next 2 days. It has tested this line numerous times in the past, so this movement could be short-lived and end up rebounding just like it did […]
Australia 200 Index was on its way up
Australia 200 Index has moved higher by 4.94% from 7618.66 to 7995.36 in the last 19 days.
Either a rebound or a breakout imminent on Hong Kong 50 Index
Hong Kong 50 Index was identified at around 17685.02 having recently rebounded of the support on the 4 hour data interval. Ultimately, the price action of the stock has formed a Channel Up pattern. This squeeze may increases the chances of a strong breakout. The projected movement will potentially take the price to around the […]
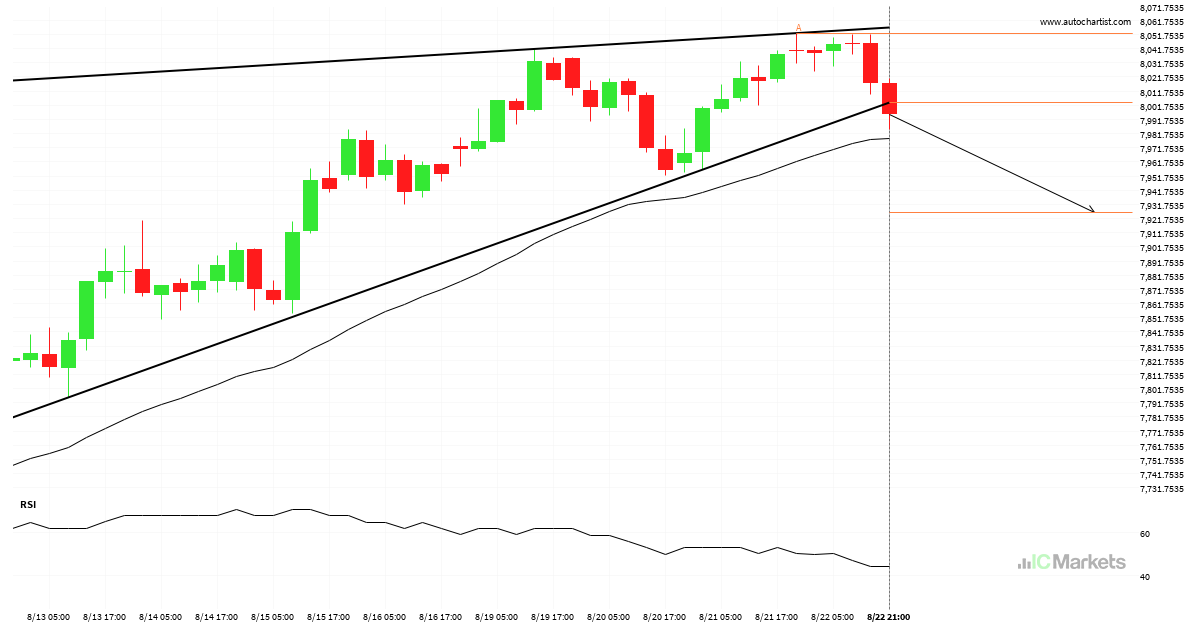
Should we expect a bearish trend on Australia 200 Index?
Australia 200 Index has broken through a support line. It has touched this line at least twice in the last 12 days. This breakout may indicate a potential move to 7926.2501 within the next 3 days. Because we have seen it retrace from this position in the past, one should wait for confirmation of the […]